
Single-basis indicator
Ticket, margin, and productivity calculated the same way across the entire chain.
Platform · Data layer
The same indicator, the same calculation basis, across the entire chain.

Each manager arrives at the meeting with their own spreadsheet and their own number. The same indicator — average ticket, margin, productivity — means one thing at one store and something else next door, because each one calculates it its own way. Comparing turns into arguing about methodology before arguing about results.
The results meeting starts by reconciling numbers, not by making decisions. The location ranking doesn't hold up, because the basis keeps changing. And the decision that depended on the data arrives after the month it was meant to correct.
Layer 03
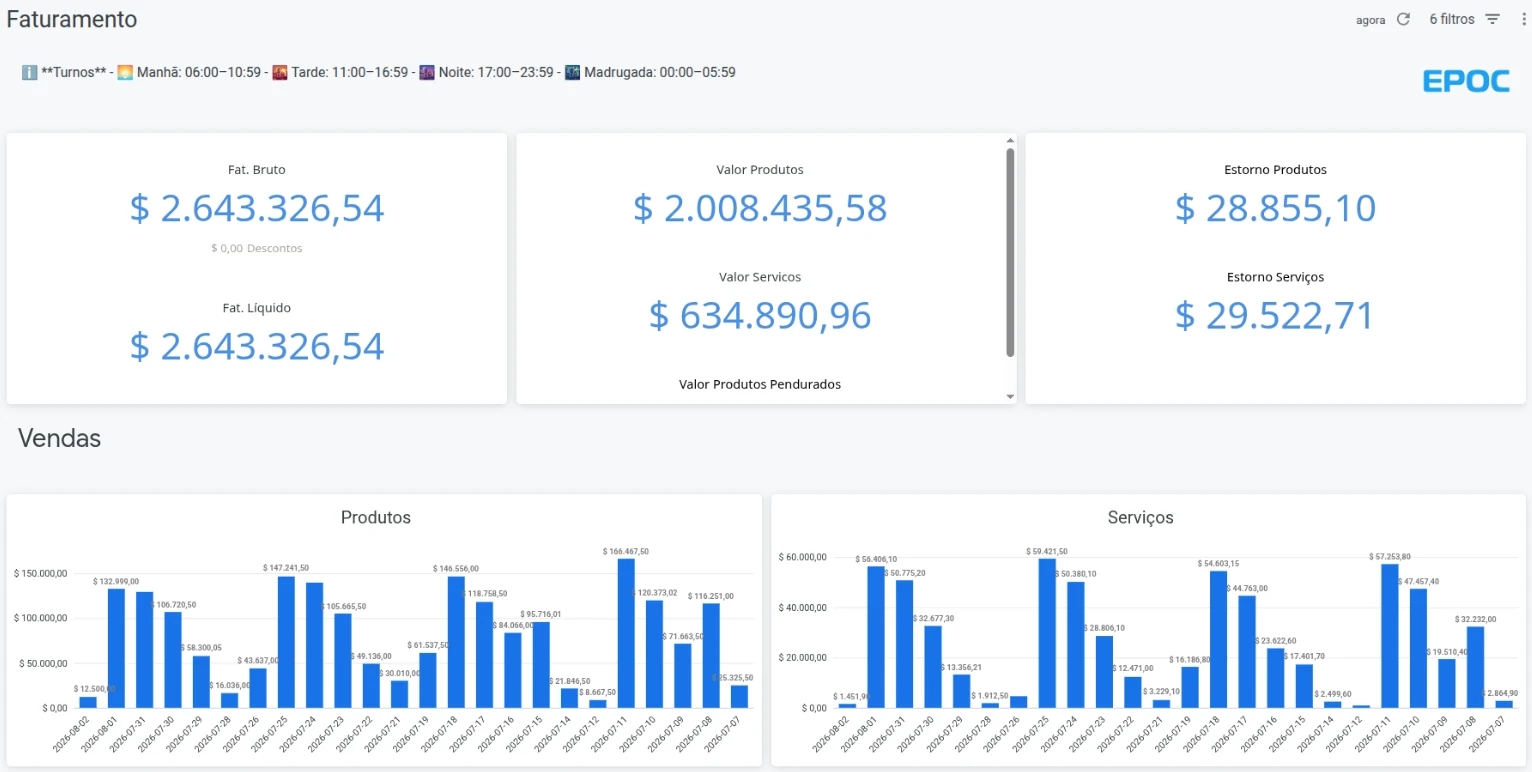
It sits on top of the Data Lake, in the data layer: it draws from the single repository and returns a comparable indicator, both in the EPOC dashboard and exported to the client's corporate BI.
Ticket, margin, and productivity calculated the same way across the entire chain.
A store ranking that holds up, because the methodology is the same for all of them.
Recipe card cost meets sale price, by product and by location.
The daily view for those who operate, and the period view for those who decide — from the same source.
The metric comes from the single repository, not from a manual export from each system.
The chain's BI team gets a Looker Enterprise license over the operation's data — and whatever is already analyzed in Power BI, Tableau, or Qlik stays there.


Floor service and margin control on the same platform.
Keep the service sequence flawless without losing sight of the cost of each dish.
Not for the essentials: there's an operational and management dashboard within the platform itself. For advanced analysis, the data is exported to the corporate BI the chain already uses.
Because the calculation is unified and comes from the Data Lake. Before, each store exported and built the metric its own way; here the definition is the same for all of them.
It factors in the recipe card cost matched against the sale price. The quality of the margin depends on the recipe card being kept up to date — which is what the inventory and recipe cards page covers.
Talk to a specialist
How many locations, what stack is already running, what needs to be integrated, and what the rollout would look like.