
What is the ABC curve?

Anyone who runs a restaurant is probably already familiar with the concept of the ABC curve, so important for managing inventory and understanding how well your operation is doing.
But if you are not familiar with this acronym yet, no problem! Below you will find out what the ABC curve is, how to calculate it and, on top of that, what benefits it offers para o seu estabelecimento.
How the ABC curve works
Also known as the ABC experience curve, this is a technique for classifying and managing a company's items – including restaurants, bars and nightclubs.
The ABC curve aims to identify which items are the most important in a business. Dessa forma, é possível priorizá-los de acordo com a relevância de cada um.
In the case of a restaurant or bar, the ABC curve makes it possible to classify menu items based on their value to the business.
The criteria that define this relevance may include:
- sales volume;
- production costs;
- profitability;
- among others.
Adapt the criteria to include the information that matters for managing and running your business.
In the ABC curve, you will classify the items into three categories, going from the most relevant to the least relevant – that is, from A to C.
This way, you can focus your actions and strategies on the products in categories A and B. You will also have the chance to find cheap, efficient solutions for managing and selling category C items.
How to calculate the ABC curve in 5 steps
Because it is so important, calculating the ABC curve can seem like a big challenge. The good news is that by following a few steps this calculation becomes much easier.
The key is to remember to collect the important information, know how to classify the items and then take strategic actions based on that analysis.
See below how to do exactly that in your restaurant, bar or nightclub!
1 – Collect the data
To start the process of calculating the ABC curve, the first step is to find the data that will be the basis of your analysis.
Since every business has its own specifics, there is no ready-made formula for which data should be used. Take into account the context of your restaurant/bar/nightclub and the goals of the business.
You can catalog, for example:
- the sales volume of each dish/drink;
- the price charged for each of them;
- how much profit each one brings (that is, the price charged minus the production cost).
2 – Sort the items
After collecting all the relevant information about each of the items sold in your business, it is time to put that data to use.
To do that, choose one of the criteria defined earlier – for example, sales volume.
So, sort each of your restaurant/bar items according to that criterion in descending order. Ou seja: classifique seus itens comercializados do menos vendido ao mais vendido.
That way, you will be able to identify which dish/drink is the best seller, which is the second, the third and so on.
Then repeat this process for each of the other criteria you defined (such as price charged, profitability etc.).
3 – Calculate the cumulative percentage
The next step is to calculate the cumulative percentage of each of the items sorted in the previous step.
This percentage represents the sum of the products' percentages, up to 100%, which equals all of the restaurant's or bar's sales.
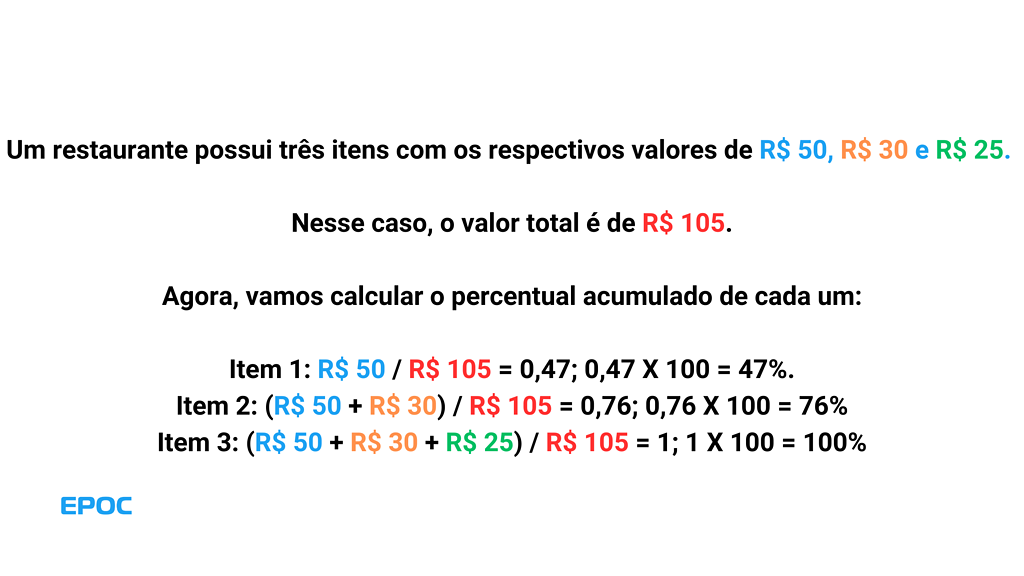
This is where the actual ABC calculation comes in. To run this calculation for an item, add up the values of the items from the top of the list to the item being analyzed and divide that number by the total value. Depois, multiply by 100 to get the value as a percentage.
To make this calculation easier to picture, see an example of the ABC Curve of each item's value below.
4 – Classify the items
After finding the values, it is time to classify the items – after the calculation part comes the A, B and C part.
This classification usually varies from business to business, but a general guideline is as follows:
- Class A – These are the items that account for 80% or more of the total amount charged (or another relevant criterion you defined);
- Class B – These are the next 15%;
- Class C – This is where the items that fall into the remaining 5% go.
5 – Analyze and make decisions
But now what? What do you do with these classifications and information? The right move is precisely to use them as the basis for decisions and strategies that boost your sales and your profitability.
Class A items are the ones that deserve the most attention, since they are the most important in the restaurant/bar. That is why it is worth always making sure they are available, that their supplies never run out in inventory and, on top of that, promoting them successfully.
B items are similar, but do not demand as much attention and, beyond that, need measures and strategies that help them sell even more. For example, create promotions and special menus/holiday dates that encourage people to order them.
Finally, class C items have simpler management and do not demand as much attention, since they do not represent such significant profit or return for the business.
3 benefits of calculating the ABC curve
As you have already seen, the ABC curve is important in helping your business understand what is a hit and what needs improving. Abaixo você confere mais sobre as vantagens de calcular a curva ABC.
1 – Improve inventory management
Calculating the inventory ABC curve optimizes your controle de estoque and the tuning of your minimum and maximum inventory, preventing your business from running out of valuable supplies.
This way, supply management and, consequently, the preparation of dishes and drinks becomes optimized and less prone to errors.
2 – Control costs
As a result of the ABC curve in restaurants and bars (and of better inventory management), there are more savings and less waste.
In the end, this also increases the business's profitability. Plus, this way you avoid buying supplies you do not need and reduce the risk of losses from expired or out-of-date products.
Savings can also come from strategic decisions such as no longer buying supplies used to make items that do not sell well or are not very profitable. This can be paired with a review of your menu.
3 – Make better decisions
While on one hand you may realize that certain items on your menu are not worth it, on the other you may discover big hits that deserve to be highlighted.
ABC curve analysis in a restaurant can point to both the most consumed products and the most profitable ones – that is, those with a low product cost and a high profit rate.
This way, you can take a series of actions to boost their sales, such as promotions, publicity, seasonal campaigns and even engenharia de cardápio to highlight dishes/drinks that are strategic for your business.
Discover the best way to calculate the ABC curve
Want a much easier, automated way to run ABC curve analysis in restaurants and bars? It is simple: count on the help of technology.
Using a restaurant management system or a bar management system like EPOC, you get a tool that does this calculation automatically.
What's more, it shows this information in detailed charts and dashboards that make it easier to understand and then to make decisions based on it.
Check out this and other features of in a free demo with no obligation with one of our specialists.
Frequently Asked Questions
What is the ABC curve?
It is a technique for classifying and managing a company's items with the goal of identifying which ones are the most important in a business. This way, it is possible to prioritize them according to how relevant each one is.In the case of a restaurant or bar, the ABC curve makes it possible to classify menu items based on their value to the business, whether in sales volume, production cost, profitability, among other criteria.
How do you calculate the ABC curve?
1 – Collect the data that will be the basis of your analysis, based on criteria that are relevant to your business;2 – Choose one of the criteria defined earlier and sort each of your restaurant/bar items according to that criterion in descending order;
3 – Calculate the cumulative percentage of each of the items sorted in the previous step. Add up the values of the items from the top of the list to the item being analyzed and divide that number by the total value. Then multiply by 100 to get the value as a percentage;
4 – Classify the items based on their relevance, with category A being the most important, followed by B and C;
5 – Based on this analysis, develop decisions and strategies that boost your sales and your profitability.
What are the benefits of calculating the ABC curve?
1 – Improve inventory management;2 – Control operating costs;
3 – Make better management decisions.